Tutorial: Building a Customer Churn Monitoring Agent
This tutorial walks you through building a practical business automation agent that monitors customer churn risk and proactively alerts your sales team to at-risk accounts.
What is "churn"? In business, customer churn refers to customers who stop doing business with you. A churn monitoring agent analyzes transaction patterns to identify customers showing signs of disengagement before they leave - enabling proactive retention efforts.
What You'll Build
A Customer Churn Monitoring Agent that:
- Queries customer transaction data from your database
- Groups and analyzes revenue trends per customer
- Identifies customers with declining engagement (>20% decline)
- Uses AI to generate personalized retention recommendations (formatted as HTML)
- Emails a weekly HTML report to your sales team
Business Value: Early warning system enabling proactive retention efforts before customers churn.
Target Audience: Sales Operations, RevOps, Customer Success teams.
Prerequisites
- Access to the Datafi platform
- A data source with customer transaction data configured
- Email service configured for notifications
Reference: Complete Agent Spec
This tutorial includes a fully working agent specification that you can:
- Import directly - Load via the
addAgentAPI and run immediately - Use as a template - Copy and modify for similar workflows
- Compare your work - Verify your agent matches the expected structure
Important: The JSON specification in the Appendix is the authoritative reference. The conversational builder will generate a starting point (typically 60-70% complete), which you'll then refine using the visual editor or by editing the JSON directly.
Part 1: Understanding the Workflow
Workflow Overview
Start
  │
  ▼
[Query] ── Fetch customer transactions with monthly aggregation
  │
  ▼
[Array: Map] ── Add month index for trend analysis
  │
  ▼
[Regression] ── Statistical trend analysis (optional visualization)
  │
  ▼
[JSON: Query] ── Group by customer, calculate decline percentage
  │
  ▼
[Array: Filter] ── Filter customers with >20% decline
  │
  ▼
[JSON: Query] ── Count at-risk customers
  │
  ▼
[Condition] ── Any at-risk customers found?
  │
  ├── No → [End]
  │
  ▼ Yes
[LLM] ── Generate HTML-formatted retention recommendations
  │
  ▼
[Table Formatter] ── Format as HTML table (for email)
  │
  ▼
[Email] ── Send HTML report to sales team
  │
  ▼
End
Tools Used
| Tool | Purpose |
|---|---|
query | Execute PRQL queries against your data sources |
array | Map and filter operations on arrays |
json | JQ expressions for grouping, counting, transforming |
regression | Statistical trend analysis |
llm | AI-powered recommendation generation |
markdown_table_formatter | Format data as HTML or markdown tables |
email | Send HTML/text notifications |
Node Types
- Start: Entry point of the workflow
- Action: Executes a tool (query, email, etc.)
- Condition: Branches based on logic
- End: Exit point of the workflow
Part 2: Using the Conversational Builder
The agent builder uses a conversational AI interface to help you create an initial workflow scaffold through natural language.
Setting Expectations: The AI builder will generate a solid starting point - typically 60-70% of what you need. You'll then refine the workflow using the visual editor (Part 3) to add details like HTML output formatting, proper variable references, and edge cases.
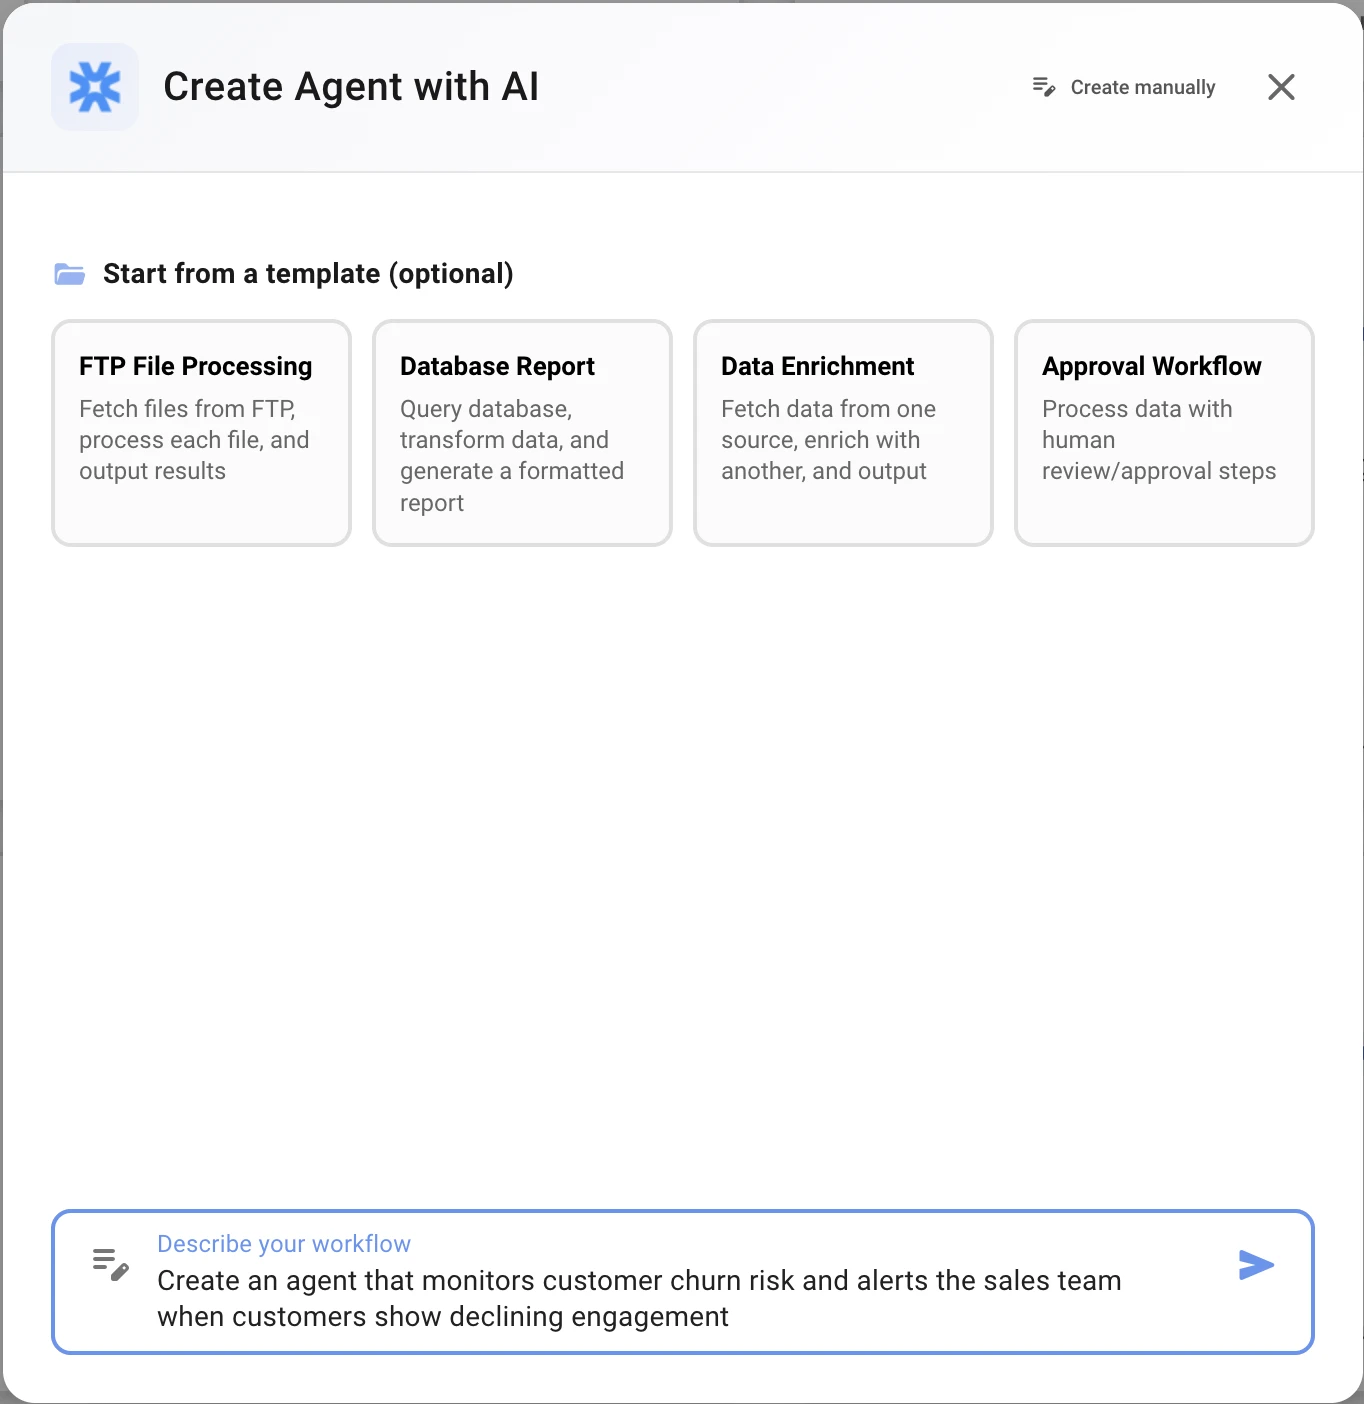
Step 1: Start a New Session
Navigate to the Agent Builder and start a new session with your initial description:
Create an agent that monitors customer churn risk and alerts the sales team
when customers show declining engagement
The AI will acknowledge your request and ask clarifying questions.
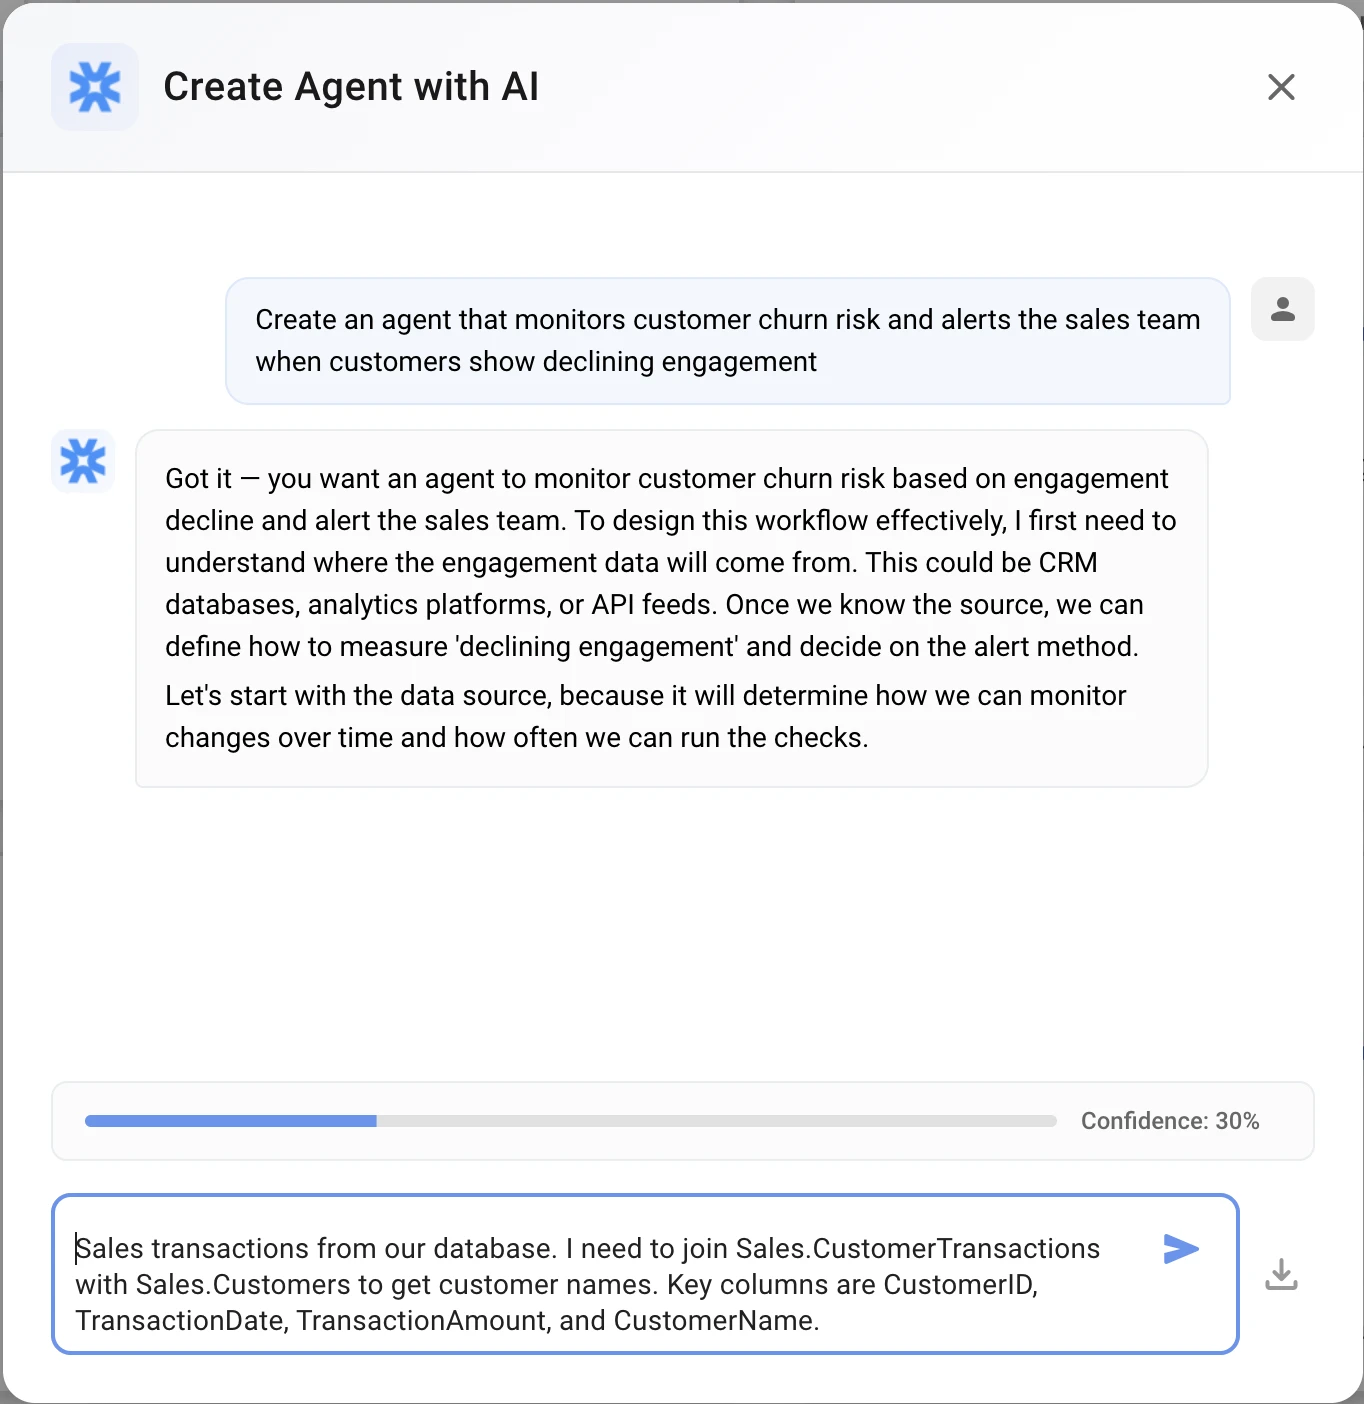
Step 2: Clarify Your Data Source
AI asks: "What data source contains your customer transaction history?"
Your response:
Sales transactions from our database. I need to join Sales.CustomerTransactions
with Sales.Customers to get customer names. Key columns are CustomerID,
TransactionDate, TransactionAmount, and CustomerName.
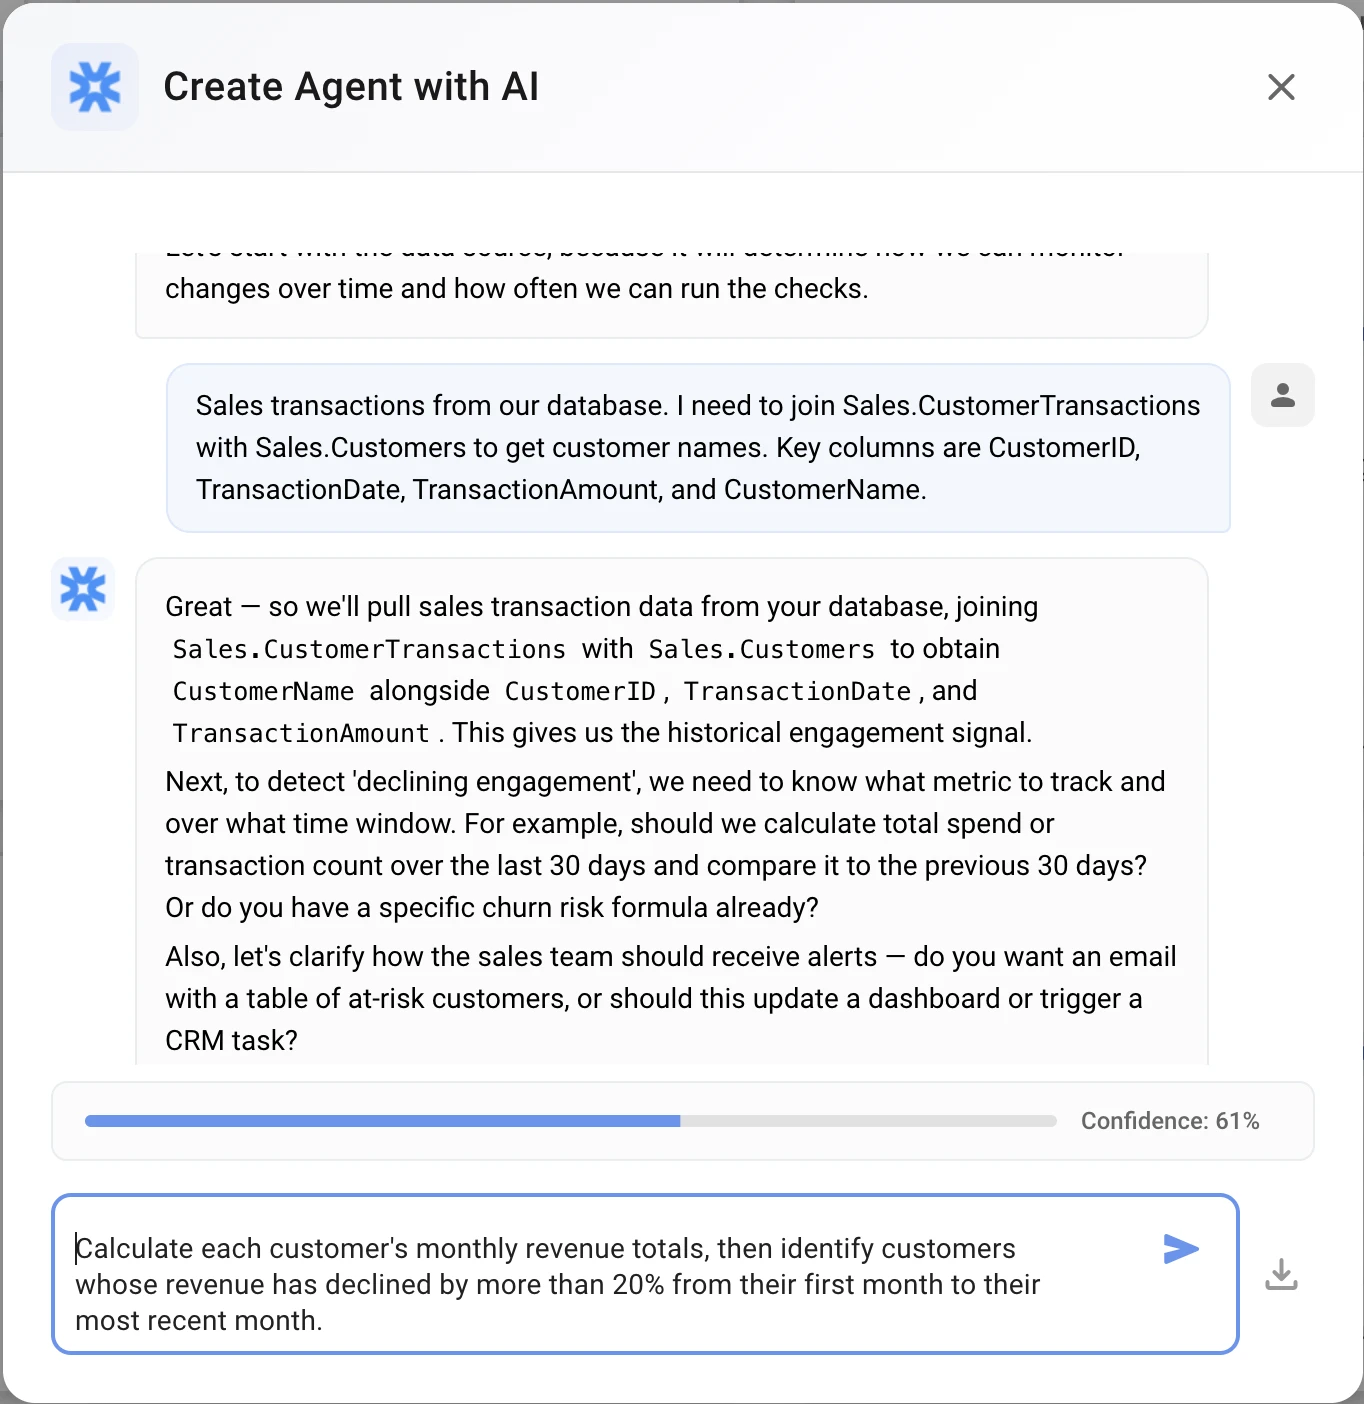
Step 3: Define At-Risk Criteria
AI asks: "How should I identify at-risk customers?"
Your response:
Calculate each customer's monthly revenue totals, then identify customers
whose revenue has declined by more than 20% from their first month to their
most recent month.
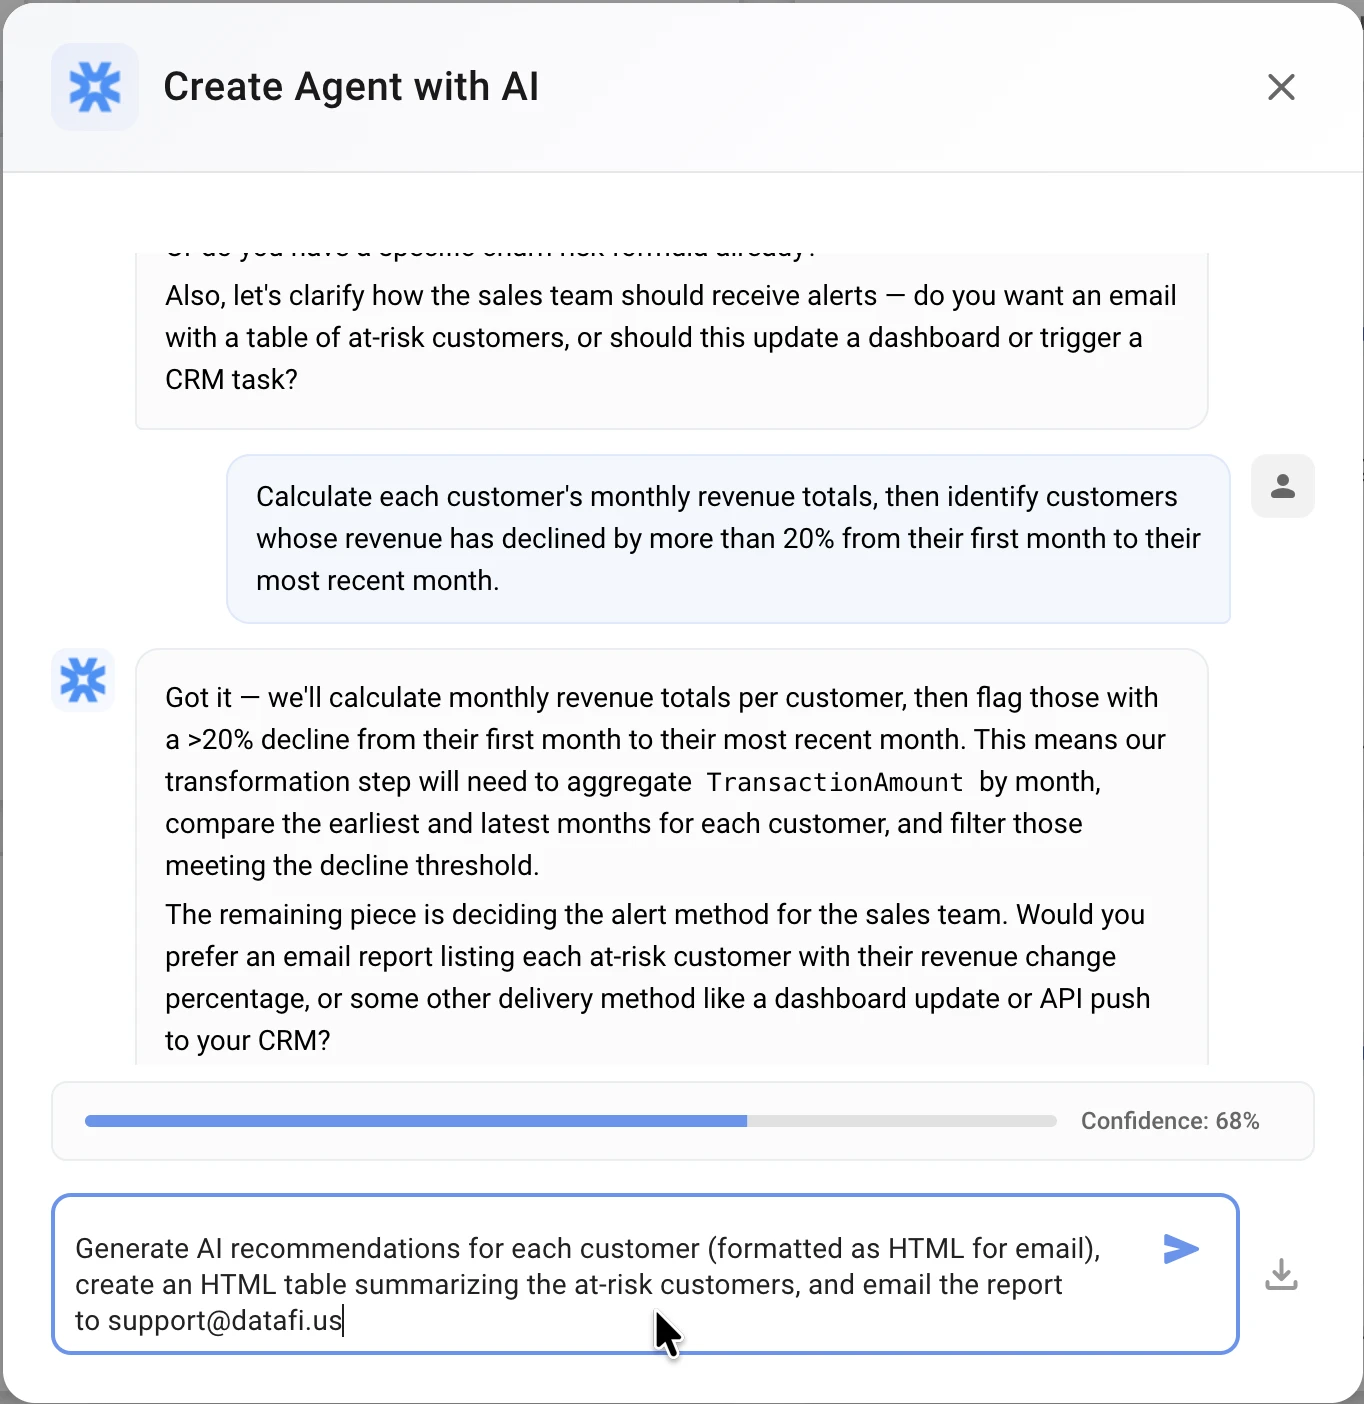
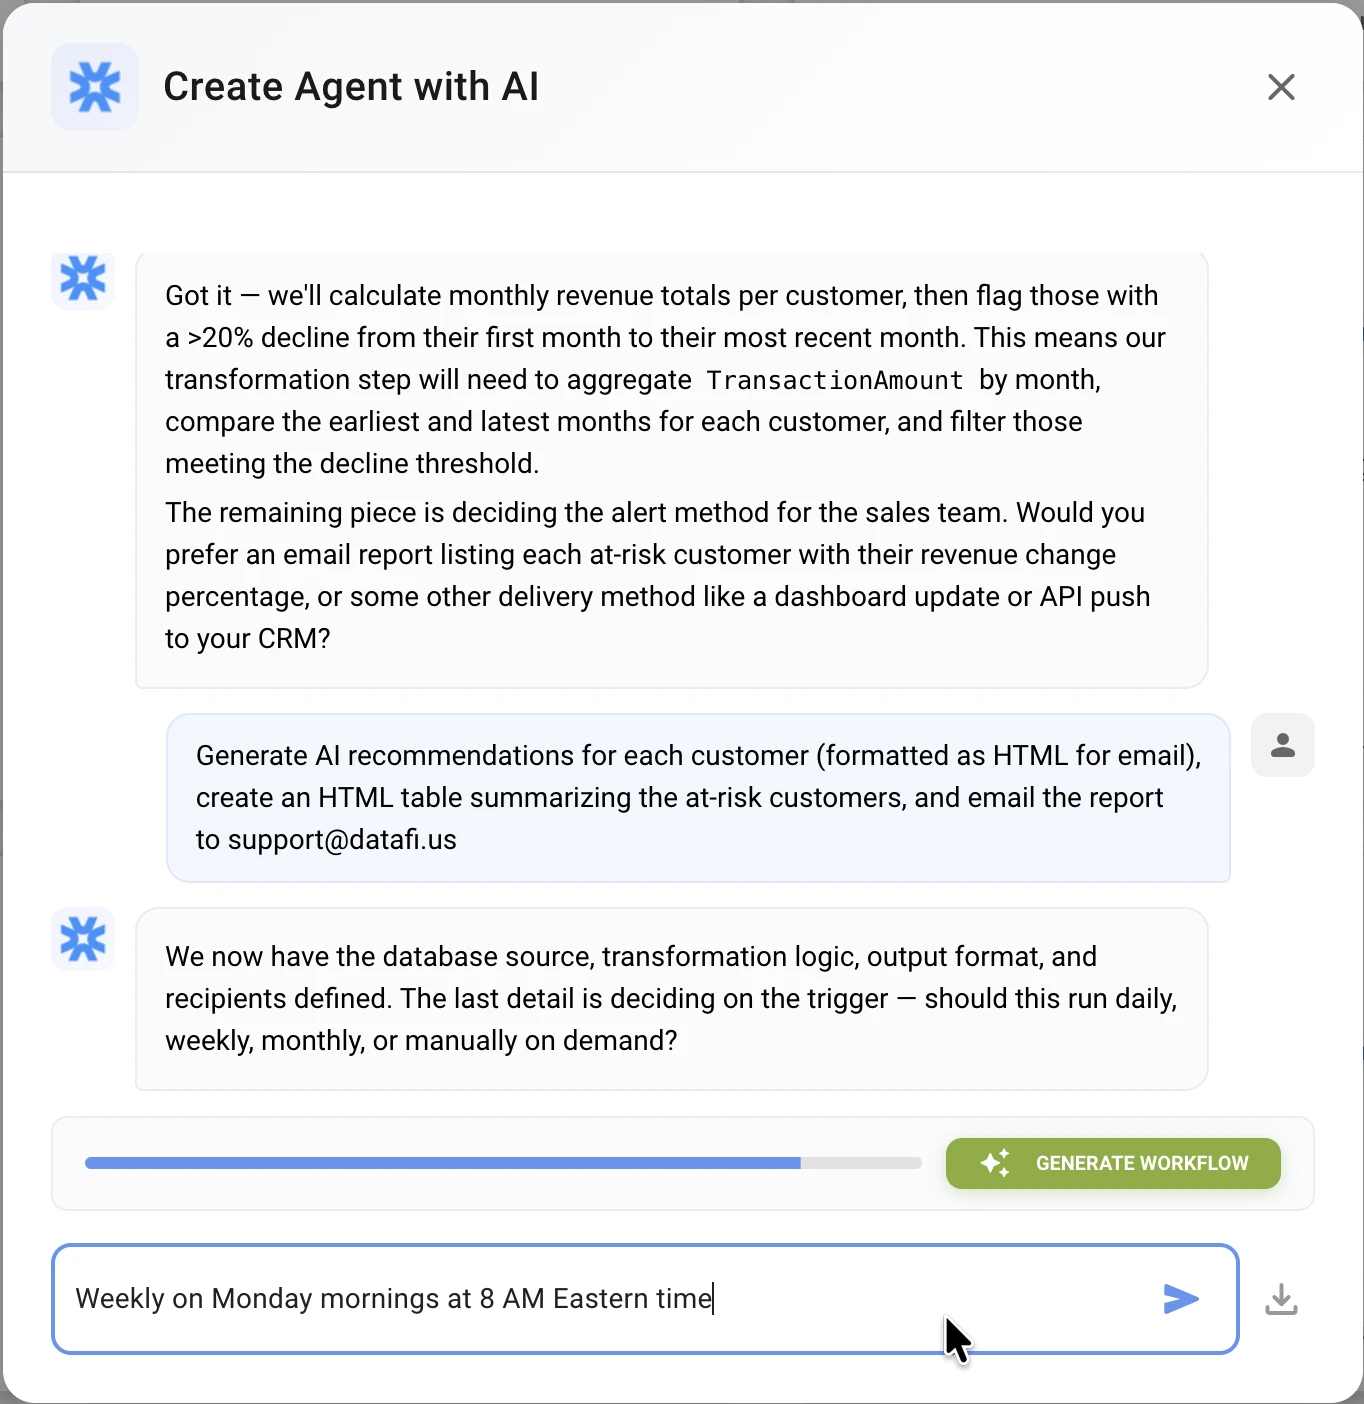
Step 4: Specify Output Format
AI asks: "What should happen when at-risk customers are found?"
Your response:
Generate AI recommendations for each customer (formatted as HTML for email),
create an HTML table summarizing the at-risk customers, and email the report
to [email protected]
Step 5: Set the Schedule
AI asks: "How often should this agent run?"
Your response:
Weekly on Monday mornings at 8 AM Eastern time
Step 6: Generate the Workflow
When the confidence indicator reaches the threshold (typically 80%+), click "Generate Workflow".
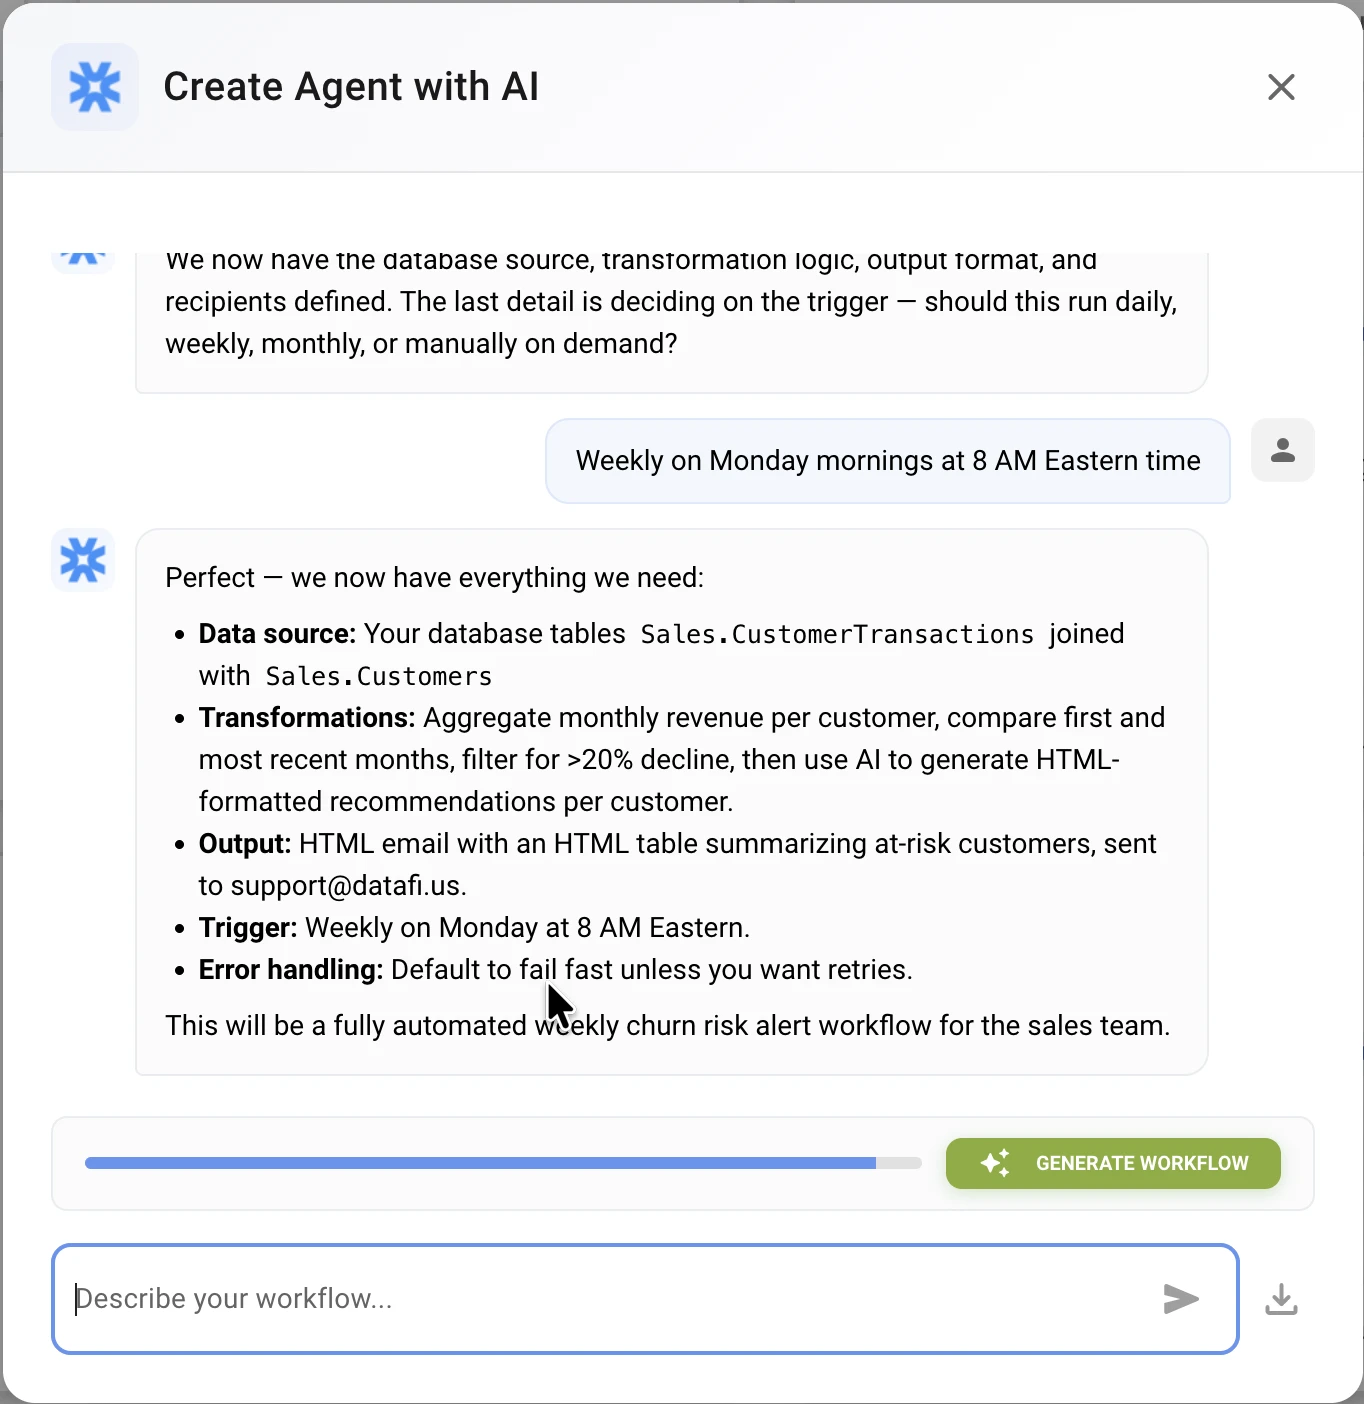
The system will create a graph-based workflow that you'll refine in the next step.
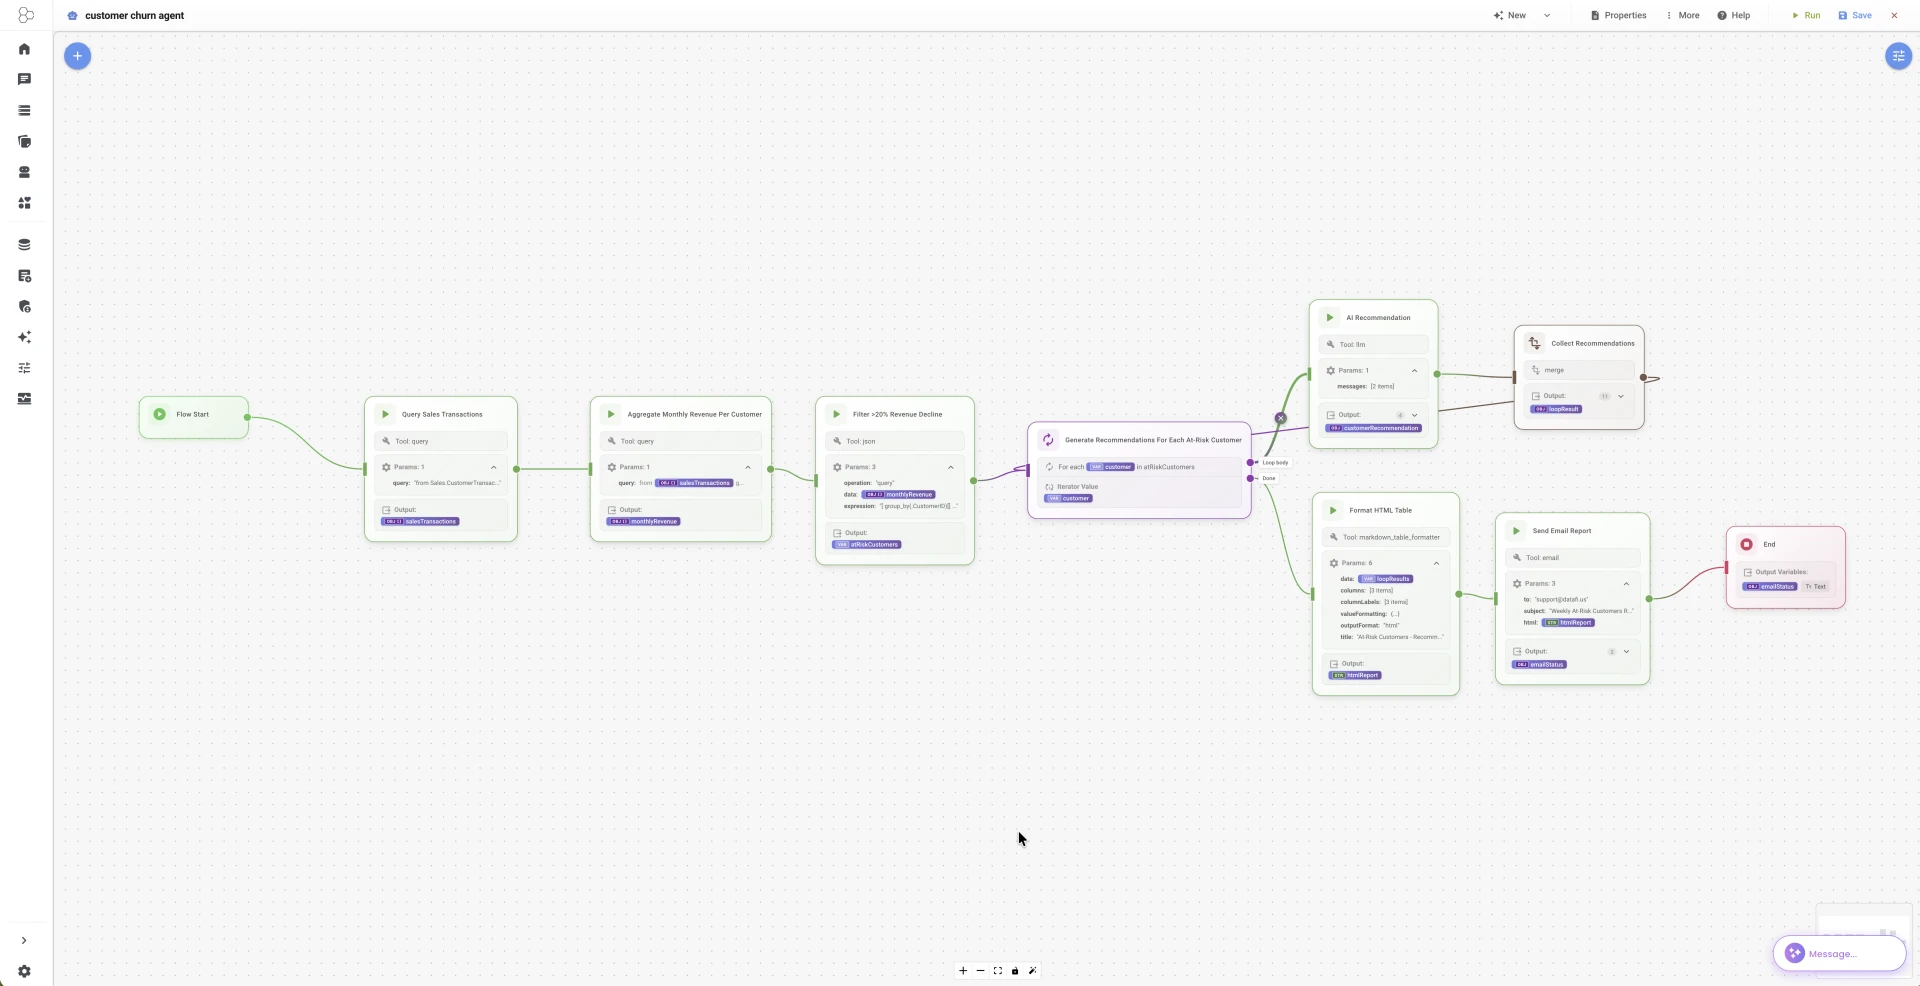
Part 3: Refining in the Visual Editor
After generation, the visual editor displays your workflow as a connected graph. This is where the real work happens - refining the AI's output into a production-ready agent.
Common Refinements You'll Make
1. Fix Data Transformations
The AI might generate placeholder transformations. Update them with actual JQ expressions:
Group by customer and calculate decline:
{
  "tool": "json",
  "params": {
    "operation": "query",
    "data": "${with_month_index}",
    "expression": "group_by(.customer_id) | map({customer_id: .[0].customer_id, customer_name: .[0].customer_name, first_month: .[0].monthly_total, last_month: .[-1].monthly_total, peak_month: (map(.monthly_total) | max), decline_percentage: (((.[0].monthly_total - .[-1].monthly_total) / (if .[0].monthly_total == 0 then 1 else .[0].monthly_total end)) * 100)})"
  }
}
2. Add Missing Nodes
You may need to add nodes the AI missed:
Count node (for displaying count in email):
{
  "tool": "json",
  "params": {
    "operation": "query",
    "data": "${at_risk}",
    "expression": "length"
  },
  "outputVar": "at_risk_count"
}
3. Configure HTML Output
For email-compatible output, set the table formatter to HTML:
{
  "tool": "markdown_table_formatter",
  "params": {
    "data": "${at_risk}",
    "columns": ["customer_name", "first_month", "last_month", "decline_percentage"],
    "columnLabels": ["Customer", "First Month Revenue", "Last Month Revenue", "Decline %"],
    "valueFormatting": {
      "first_month": {"prefix": "$"},
      "last_month": {"prefix": "$"},
      "decline_percentage": {"suffix": "%"}
    },
    "outputFormat": "html"
  }
}
4. Configure LLM for HTML Output
Tell the LLM to output HTML (not markdown) for proper email rendering:
{
  "tool": "llm",
  "params": {
    "messages": [
      {
        "role": "system",
        "content": "You are a customer success expert. Generate specific, actionable retention recommendations based on customer data. Format your response as HTML (use <h4>, <p>, <ul>, <li>, <strong> tags). Do NOT use markdown syntax."
      },
      {
        "role": "user",
        "content": "Analyze these at-risk customers and provide 2-3 retention recommendations for each:\n\n${at_risk}\n\nFor each customer, consider their decline percentage and transaction history. Output as HTML."
      }
    ]
  }
}
5. Build the Email Template
Construct the HTML email body with variable substitution:
{
  "tool": "email",
  "params": {
    "to": "${email_recipients}",
    "subject": "Weekly At-Risk Customer Alert - ${at_risk_count} customers need attention",
    "html": "<h2>Weekly At-Risk Customer Alert</h2>\n<p><strong>Report Date:</strong> ${report_date}</p>\n<p><strong>At-Risk Customers Found:</strong> ${at_risk_count}</p>\n\n<h3>At-Risk Customer Summary</h3>\n${report_table}\n\n<h3>Retention Recommendations</h3>\n<div>${recommendations.response}</div>\n\n<hr>\n<p><em>Generated by Customer Churn Monitoring Agent</em></p>"
  }
}
Key insight: Use
${recommendations.response}to extract just the text from the LLM response object, not the full JSON.
Testing Your Workflow
- Click "Run Now" to execute manually
- Watch real-time progress via the execution panel
- Review each node's output - check for errors
- Verify the email renders correctly (HTML table, formatted recommendations)
Part 4: Key Technical Details
PRQL Query Structure
The query node fetches transactions with monthly aggregation:
from t = Sales.CustomerTransactions
join c = Sales.Customers (t.CustomerID == c.CustomerID)
select {
  transaction_date = t.TransactionDate,
  customer_id = t.CustomerID,
  customer_name = c.CustomerName,
  amount = t.TransactionAmount,
  year = s"YEAR(TransactionDate)",
  month = s"MONTH(TransactionDate)"
}
filter transaction_date >= '${start_date}'
group {customer_id, customer_name, year, month} (
  aggregate {
    monthly_total = sum amount,
    transaction_count = count this
  }
)
sort {customer_id, year, month}
Variable Substitution Patterns
| Pattern | Use Case |
|---|---|
${variable_name} | Simple variable substitution |
${object.property} | Access nested properties (e.g., ${recommendations.response}) |
${at_risk_count} | Use computed values (requires separate count node) |
Note:
${array.length}works in Condition nodes but NOT in string templates. Create a separate count node for email subjects/body.
Filter Expression Syntax
The array tool uses JQ-style expressions:
{
  "operation": "filter",
  "data": "${customer_trends}",
  "expression": ".decline_percentage > 20"
}
Percentage Calculation
Store percentages as actual numbers (100 = 100%, not 1.0):
decline_percentage: (((first - last) / first) * 100)
Then format with suffix in the table:
"valueFormatting": {
  "decline_percentage": {"suffix": "%"}
}
Part 5: Running and Monitoring
Manual Execution
- Navigate to your agent in the dashboard
- Click "Run Now"
- Watch execution progress in real-time
- View node-by-node output in the execution log
Scheduled Execution
Configure the schedule in the agent's lifecycle settings:
{
  "trigger": {
    "Schedule": {
      "cron": "0 8 * * MON",
      "timezone": "America/New_York"
    }
  }
}
Cron expression breakdown:
0- At minute 08- At hour 8 (8 AM)*- Every day of month*- Every monthMON- On Mondays
Monitoring Execution History
Track your agent's performance:
- Run History: View past executions, success/failure status
- Execution Logs: Detailed output from each node
- Token Usage: Monitor LLM token consumption
- Error Tracking: Identify and debug failures
Part 6: Next Steps
Customize for Your Data
Replace the placeholder table names with your actual schema:
-- Template (in sample spec)
from t = Sales.CustomerTransactions
join c = Sales.Customers (t.CustomerID == c.CustomerID)

-- Your data (customize)
from t = YourSchema.Orders
join c = YourSchema.Customers (t.customer_id == c.id)
Add Human Approval
Insert a HumanInput node before the email step to review the report:
{
  "type": "HumanInput",
  "data": {
    "label": "Review At-Risk Report",
    "prompt": "Please review the at-risk customer report before sending to the sales team.",
    "options": ["Approve and Send", "Edit Report", "Cancel"]
  }
}
Expand Your Analysis
Add more sophisticated churn indicators:
- Support ticket analysis: Flag customers with increased support requests
- Login frequency: Track declining platform usage
- NPS scores: Incorporate customer satisfaction data
- Contract renewal dates: Prioritize customers approaching renewal
Build More Agents
Apply the same patterns to other business problems:
- Lead Scoring Agent: Score and prioritize inbound leads
- Revenue Forecasting Agent: Generate weekly revenue projections
- Competitor Monitoring Agent: Track competitor pricing and features
- Invoice Reconciliation Agent: Automate invoice matching and discrepancy detection
Summary
You've learned how to:
- Understand the workflow structure - Query, transform, analyze, act
- Use the conversational builder - Generate a 60-70% starting point
- Refine in the visual editor - Add HTML formatting, fix transformations, handle edge cases
- Configure for production - Proper variable substitution, HTML output, email templates
- Monitor and iterate - Test, debug, and improve
The key insight: The JSON specification is your source of truth. The conversational builder accelerates creation, but production-quality agents require hands-on refinement.
For more information, see:
Appendix: Complete Agent Specification
Below is the complete, production-ready agent specification. This is the gold standard - import it directly via the addAgent API to see a fully working agent, or use it as a reference when building your own.
Key Configuration Highlights
Workflow Variables (customize these for your environment):
{
  "start_date": "2024-01-01",
  "decline_threshold": 20,
  "email_recipients": "[email protected]",
  "report_date": "2024-03-20"
}
Critical Implementation Details:
- Decline percentage stored as actual percentage (100, not 1.0)
- HTML output format for email-compatible tables
- LLM instructed to output HTML (not markdown)
- Separate count node for
${at_risk_count}in email - Use
${recommendations.response}to extract LLM text from response object
Schedule Trigger:
{
  "trigger": {
    "Schedule": {
      "cron": "0 8 * * MON",
      "timezone": "America/New_York"
    }
  }
}
Workflow Node Summary
| Node ID | Tool | Purpose |
|---|---|---|
query_transactions | query | Fetch and aggregate transaction data |
add_month_index | array (map) | Add month index for sorting |
analyze_trends | regression | Statistical trend visualization |
calculate_trends | json (query) | Group by customer, calculate decline % |
filter_at_risk | array (filter) | Filter customers >20% decline |
count_at_risk | json (query) | Count for email subject/body |
check_at_risk | condition | Branch if any at-risk found |
generate_recommendations | llm | AI recommendations (HTML format) |
format_report | markdown_table_formatter | HTML table for email |
send_email | Send HTML report |
Full Agent Specification (JSON)
{
  "identity": {
    "name": "customer-churn-monitor",
    "version": "1.0.0",
    "description": "Analyzes customer transaction patterns to detect churn risk (customers likely to stop doing business). Identifies declining revenue trends, generates AI-powered retention recommendations, and sends weekly alerts to the sales team.",
    "author": "Datafi",
    "tags": ["sales", "customer-success", "churn-prevention", "analytics"],
    "goals": [
      "Identify customers with declining revenue trends",
      "Generate actionable retention recommendations",
      "Deliver weekly alerts to sales team"
    ],
    "successCriteria": [
      {
        "metric": "at_risk_detection_rate",
        "target": 0.9,
        "measurement": "detected_churned / actual_churned"
      },
      {
        "metric": "report_delivery",
        "target": "100%",
        "measurement": "reports_sent / reports_scheduled"
      }
    ]
  },
  "capabilities": {
    "tools": [
      { "name": "query", "permissions": { "allowedOperations": ["Read"] } },
      { "name": "array", "permissions": { "allowedOperations": ["Read"] } },
      { "name": "json", "permissions": { "allowedOperations": ["Read"] } },
      { "name": "regression", "permissions": { "allowedOperations": ["Read"] } },
      { "name": "llm", "permissions": { "allowedOperations": ["Read"] } },
      { "name": "markdown_table_formatter", "permissions": { "allowedOperations": ["Read"] } },
      { "name": "email", "permissions": { "allowedOperations": ["Write"] } }
    ],
    "skills": ["trend_analysis", "churn_prediction", "report_generation"],
    "maxIterations": 25,
    "supportedDataSources": [],
    "outputFormats": []
  },
  "behavior": {
    "executionMode": "Sequential",
    "retryPolicy": {
      "maxAttempts": 3,
      "backoffStrategy": "Exponential",
      "initialDelaySeconds": 5,
      "maxDelaySeconds": 60,
      "retryOn": ["network_error", "timeout", "rate_limit"],
      "doNotRetry": ["validation_error", "permission_denied"]
    },
    "timeoutSeconds": 300,
    "concurrencyLimit": 1,
    "personality": {
      "tone": "professional",
      "verbosity": "concise",
      "jargonLevel": "business_appropriate",
      "interactionStyle": "proactive"
    },
    "reasoningStrategy": {
      "approach": "StepByStep",
      "explorationMode": "depth_first",
      "confidenceThreshold": 0.75,
      "explainReasoning": true
    }
  },
  "guards": {
    "constraints": [
      "Never modify production data",
      "PII must be masked in email outputs",
      "Only read from approved data sources"
    ],
    "validationRules": [],
    "outputFilters": [],
    "resourceLimits": {
      "maxTokensPerRequest": 10000,
      "maxApiCallsPerRun": 100,
      "dailyTokenBudget": 50000
    },
    "rateLimits": {},
    "sensitiveDataHandling": {
      "classificationLevels": ["Internal"],
      "encryptionRequired": [],
      "auditAccess": true
    },
    "approvalRequirements": [],
    "allowedDatabases": [],
    "blockedDatabases": [],
    "preventPiiExposure": false,
    "preventSqlInjection": true
  },
  "testing": {
    "testScenarios": [],
    "mockData": {},
    "benchmarks": [],
    "evaluationMetrics": [],
    "regressionTests": [],
    "mockEnvironments": [],
    "benchmarkDatasets": []
  },
  "lifecycle": {
    "trigger": {
      "Schedule": {
        "cron": "0 8 * * MON",
        "timezone": "America/New_York"
      }
    },
    "dependencies": [],
    "versioningStrategy": "",
    "deprecationPolicy": null,
    "updateMechanism": null
  },
  "integration": {
    "inputSchema": {
      "type": "object",
      "properties": {
        "lookback_months": {
          "type": "integer",
          "default": 6,
          "description": "Number of months to analyze"
        },
        "decline_threshold": {
          "type": "number",
          "default": 20,
          "description": "Minimum decline percentage to flag (e.g., 20 = 20%)"
        },
        "email_recipients": {
          "type": "string",
          "default": "[email protected]",
          "description": "Email address for alerts"
        }
      }
    },
    "outputSchema": {
      "type": "object",
      "properties": {
        "at_risk_count": { "type": "integer" },
        "report_sent": { "type": "boolean" }
      }
    },
    "webhooks": [],
    "eventEmitters": [],
    "apiEndpoints": []
  },
  "monitoring": {
    "metrics": [
      { "metric": "customers_analyzed", "type": "Counter" },
      { "metric": "at_risk_detected", "type": "Counter" },
      { "metric": "execution_duration_seconds", "type": "Histogram" }
    ],
    "alerts": [],
    "logging": { "level": "Info" },
    "tracing": {}
  },
  "workflow": {
    "nodes": [
      {
        "id": "start_0",
        "type": "agentFlow",
        "position": { "x": 100, "y": 100 },
        "data": {
          "id": "start_0",
          "type": "Start",
          "label": "Start",
          "name": "Start",
          "outputAnchors": [{ "id": "start_0-out", "name": "output" }]
        }
      },
      {
        "id": "query_transactions",
        "type": "agentFlow",
        "position": { "x": 100, "y": 200 },
        "data": {
          "id": "query_transactions",
          "type": "Action",
          "label": "Query Customer Transactions",
          "name": "Query Customer Transactions",
          "inputs": {
            "tool": "query",
            "params": {
              "query": "from t = Sales.CustomerTransactions\njoin c = Sales.Customers (t.CustomerID == c.CustomerID)\nselect {\n  transaction_date = t.TransactionDate,\n  customer_id = t.CustomerID,\n  customer_name = c.CustomerName,\n  amount = t.TransactionAmount,\n  year = s\"YEAR(TransactionDate)\",\n  month = s\"MONTH(TransactionDate)\"\n}\nfilter transaction_date >= '${start_date}'\ngroup {customer_id, customer_name, year, month} (\n  aggregate {\n    monthly_total = sum amount,\n    transaction_count = count this\n  }\n)\nsort {customer_id, year, month}"
            },
            "outputVar": "transactions"
          },
          "outputAnchors": [{ "id": "query_transactions-out", "name": "output" }]
        }
      },
      {
        "id": "add_month_index",
        "type": "agentFlow",
        "position": { "x": 100, "y": 300 },
        "data": {
          "id": "add_month_index",
          "type": "Action",
          "label": "Add Month Index",
          "name": "Add Month Index",
          "inputs": {
            "tool": "array",
            "params": {
              "operation": "map",
              "data": "${transactions}",
              "expression": ". + {month_index: (.year * 12 + .month)}"
            },
            "outputVar": "with_month_index"
          },
          "outputAnchors": [{ "id": "add_month_index-out", "name": "output" }]
        }
      },
      {
        "id": "analyze_trends",
        "type": "agentFlow",
        "position": { "x": 100, "y": 400 },
        "data": {
          "id": "analyze_trends",
          "type": "Action",
          "label": "Analyze Revenue Trends",
          "name": "Analyze Revenue Trends",
          "inputs": {
            "tool": "regression",
            "params": {
              "data": "${with_month_index}",
              "groupBy": "customer_id",
              "xColumn": "month_index",
              "yColumn": "monthly_total",
              "confidenceLevel": 0.95
            },
            "outputVar": "regression_result"
          },
          "outputAnchors": [{ "id": "analyze_trends-out", "name": "output" }]
        }
      },
      {
        "id": "calculate_trends",
        "type": "agentFlow",
        "position": { "x": 100, "y": 500 },
        "data": {
          "id": "calculate_trends",
          "type": "Action",
          "label": "Calculate Customer Trends",
          "name": "Calculate Customer Trends",
          "inputs": {
            "tool": "json",
            "params": {
              "operation": "query",
              "data": "${with_month_index}",
              "expression": "group_by(.customer_id) | map({customer_id: .[0].customer_id, customer_name: .[0].customer_name, first_month: .[0].monthly_total, last_month: .[-1].monthly_total, peak_month: (map(.monthly_total) | max), decline_percentage: (((.[0].monthly_total - .[-1].monthly_total) / (if .[0].monthly_total == 0 then 1 else .[0].monthly_total end)) * 100)})"
            },
            "outputVar": "customer_trends"
          },
          "outputAnchors": [{ "id": "calculate_trends-out", "name": "output" }]
        }
      },
      {
        "id": "filter_at_risk",
        "type": "agentFlow",
        "position": { "x": 100, "y": 700 },
        "data": {
          "id": "filter_at_risk",
          "type": "Action",
          "label": "Filter At-Risk Customers",
          "name": "Filter At-Risk Customers",
          "inputs": {
            "tool": "array",
            "params": {
              "operation": "filter",
              "data": "${customer_trends}",
              "expression": ".decline_percentage > 20"
            },
            "outputVar": "at_risk"
          },
          "outputAnchors": [{ "id": "filter_at_risk-out", "name": "output" }]
        }
      },
      {
        "id": "count_at_risk",
        "type": "agentFlow",
        "position": { "x": 100, "y": 750 },
        "data": {
          "id": "count_at_risk",
          "type": "Action",
          "label": "Count At-Risk Customers",
          "name": "Count At-Risk Customers",
          "inputs": {
            "tool": "json",
            "params": {
              "operation": "query",
              "data": "${at_risk}",
              "expression": "length"
            },
            "outputVar": "at_risk_count"
          },
          "outputAnchors": [{ "id": "count_at_risk-out", "name": "output" }]
        }
      },
      {
        "id": "check_at_risk",
        "type": "agentFlow",
        "position": { "x": 100, "y": 800 },
        "data": {
          "id": "check_at_risk",
          "type": "Condition",
          "label": "Any At-Risk Customers?",
          "name": "Any At-Risk Customers?",
          "inputs": {
            "condition": "${at_risk_count} > 0",
            "params": {}
          },
          "outputAnchors": [
            { "id": "check_at_risk-true", "name": 0, "label": "True" },
            { "id": "check_at_risk-false", "name": 1, "label": "False" }
          ]
        }
      },
      {
        "id": "generate_recommendations",
        "type": "agentFlow",
        "position": { "x": 100, "y": 900 },
        "data": {
          "id": "generate_recommendations",
          "type": "Action",
          "label": "Generate Retention Recommendations",
          "name": "Generate Retention Recommendations",
          "inputs": {
            "tool": "llm",
            "params": {
              "messages": [
                {
                  "role": "system",
                  "content": "You are a customer success expert. Generate specific, actionable retention recommendations based on customer data. Format your response as HTML (use <h4>, <p>, <ul>, <li>, <strong> tags). Do NOT use markdown syntax."
                },
                {
                  "role": "user",
                  "content": "Analyze these at-risk customers and provide 2-3 retention recommendations for each:\n\n${at_risk}\n\nFor each customer, consider their decline percentage and transaction history. Output as HTML."
                }
              ]
            },
            "outputVar": "recommendations"
          },
          "outputAnchors": [{ "id": "generate_recommendations-out", "name": "output" }]
        }
      },
      {
        "id": "format_report",
        "type": "agentFlow",
        "position": { "x": 100, "y": 1000 },
        "data": {
          "id": "format_report",
          "type": "Action",
          "label": "Format Report",
          "name": "Format Report",
          "inputs": {
            "tool": "markdown_table_formatter",
            "params": {
              "data": "${at_risk}",
              "columns": ["customer_name", "first_month", "last_month", "decline_percentage"],
              "columnLabels": ["Customer", "First Month Revenue", "Last Month Revenue", "Decline %"],
              "sortBy": ["decline_percentage"],
              "valueFormatting": {
                "first_month": { "prefix": "$" },
                "last_month": { "prefix": "$" },
                "decline_percentage": { "suffix": "%" }
              },
              "outputFormat": "html"
            },
            "outputVar": "report_table"
          },
          "outputAnchors": [{ "id": "format_report-out", "name": "output" }]
        }
      },
      {
        "id": "send_email",
        "type": "agentFlow",
        "position": { "x": 100, "y": 1100 },
        "data": {
          "id": "send_email",
          "type": "Action",
          "label": "Send Alert Email",
          "name": "Send Alert Email",
          "inputs": {
            "tool": "email",
            "params": {
              "to": "${email_recipients}",
              "subject": "Weekly At-Risk Customer Alert - ${at_risk_count} customers need attention",
              "html": "<h2>Weekly At-Risk Customer Alert</h2>\n<p><strong>Report Date:</strong> ${report_date}</p>\n<p><strong>At-Risk Customers Found:</strong> ${at_risk_count}</p>\n\n<h3>At-Risk Customer Summary</h3>\n${report_table}\n\n<h3>Retention Recommendations</h3>\n<div>${recommendations.response}</div>\n\n<hr>\n<p><em>Generated by Customer Churn Monitoring Agent</em></p>"
            }
          },
          "outputAnchors": [{ "id": "send_email-out", "name": "output" }]
        }
      },
      {
        "id": "end_success",
        "type": "agentFlow",
        "position": { "x": 175, "y": 1400 },
        "data": {
          "id": "end_success",
          "type": "End",
          "label": "End (Report Sent)",
          "name": "End",
          "outputAnchors": []
        }
      },
      {
        "id": "end_no_risk",
        "type": "agentFlow",
        "position": { "x": 300, "y": 900 },
        "data": {
          "id": "end_no_risk",
          "type": "End",
          "label": "End (No At-Risk)",
          "name": "End",
          "outputAnchors": []
        }
      }
    ],
    "edges": [
      { "id": "e1", "source": "start_0", "target": "query_transactions", "type": "workflow", "data": {} },
      { "id": "e2", "source": "query_transactions", "target": "add_month_index", "sourceHandle": "query_transactions-out", "type": "workflow", "data": {} },
      { "id": "e3", "source": "add_month_index", "target": "analyze_trends", "sourceHandle": "add_month_index-out", "type": "workflow", "data": {} },
      { "id": "e3b", "source": "analyze_trends", "target": "calculate_trends", "sourceHandle": "analyze_trends-out", "type": "workflow", "data": {} },
      { "id": "e4", "source": "calculate_trends", "target": "filter_at_risk", "sourceHandle": "calculate_trends-out", "type": "workflow", "data": {} },
      { "id": "e5", "source": "filter_at_risk", "target": "count_at_risk", "sourceHandle": "filter_at_risk-out", "type": "workflow", "data": {} },
      { "id": "e5b", "source": "count_at_risk", "target": "check_at_risk", "sourceHandle": "count_at_risk-out", "type": "workflow", "data": {} },
      { "id": "e6", "source": "check_at_risk", "target": "generate_recommendations", "sourceHandle": "check_at_risk-true", "type": "workflow", "data": {} },
      { "id": "e7", "source": "check_at_risk", "target": "end_no_risk", "sourceHandle": "check_at_risk-false", "type": "workflow", "data": {} },
      { "id": "e8", "source": "generate_recommendations", "target": "format_report", "sourceHandle": "generate_recommendations-out", "type": "workflow", "data": {} },
      { "id": "e9", "source": "format_report", "target": "send_email", "sourceHandle": "format_report-out", "type": "workflow", "data": {} },
      { "id": "e10", "source": "send_email", "target": "end_success", "sourceHandle": "send_email-out", "type": "workflow", "data": {} }
    ],
    "errorHandling": "FailFast",
    "variables": {
      "start_date": "2024-01-01",
      "decline_threshold": 20,
      "report_date": "2024-03-20",
      "email_recipients": "[email protected]"
    }
  }
}